When our health system began planning for a centralized offsite reprocessing center, I knew that success would require more than just expanding capacity. We needed a deeper understanding of how our instruments moved, where bottlenecks existed, and how quality was being measured. That’s when I began working with Ascendco Health to manage analytics in a more intentional way not simply to track metrics, but to build a framework for smarter decision-making.
From the start, my approach to leadership has been rooted in continuous improvement. You can’t improve what you can’t measure, and data has given me a voice to present facts rather than just opinions. For sterile processing, that’s critical, because many don’t see the complexity of our work. Through analytics, I can justify needs, build collaboration across departments, and empower my teams to make real-time decisions.
Over time, I’ve worked closely with Ascendco Health to develop dashboards that reflect our realities on the ground. These tools aren’t meant to overwhelm people with numbers; they’re designed to make sense of complex workflows and spark improvement. This collaboration ensures the dashboards are not just data points, but practical tools we can use to improve staffing, strengthen quality, and communicate our value across the system. Over time, this process has helped my team embrace data as part of their daily rhythm and see themselves as drivers of improvement, not just consumers of reports.
Dashboards that Changed the Way We Work
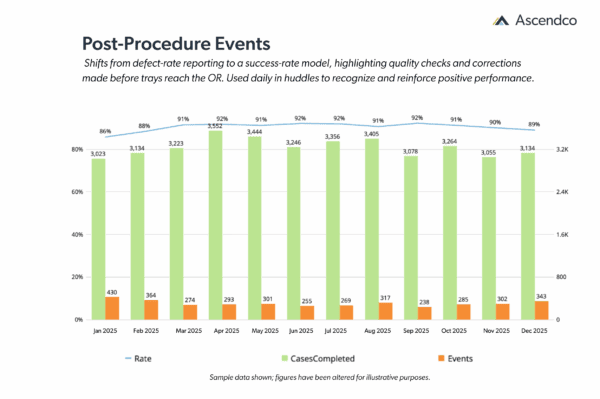
Post-Procedure Events – Positive Framing
We reframed post-procedure reporting from a defect-based lens to a success-rate model, which highlights the “great catches” our staff make before trays ever return to the OR. What was once viewed as punitive became a recognition tool, boosting morale, strengthening OR collaboration, and bringing energy into daily huddles and leadership reviews.

Error Rates vs. Assembly Volume
This blind benchmarking dashboard balances individual error rates against total trays assembled, ensuring a fair comparison across peers. By adding context, it transforms error tracking from a “gotcha” moment into a learning tool that promotes accountability, healthy competition, and continuous self-improvement.
Offsite Processing Strategy
Managing both onsite and offsite operations at scale is complex, and this dashboard gave us visibility into turnaround times, delivery schedules, and capacity. With real-time insights, we identified bottlenecks, optimized staffing and logistics, and discovered that our offsite model was performing even better than expected.
Transport & Storage Compliance
By tracking the time between sterilization and storage at both role and user levels, this dashboard exposed small but costly shelving delays. The visibility allowed us to pinpoint bottlenecks, improve handoffs between teams, and strengthen accountability, which in turn streamlined workflows across facilities.
Certified vs. Uncertified Staff Performance
To better understand the impact of certification, we built a dashboard comparing the productivity and quality of certified and uncertified technicians. The data sparked policy conversations, reinforced the value of certification, and guided training partnerships, turning assumptions into evidence-based action.
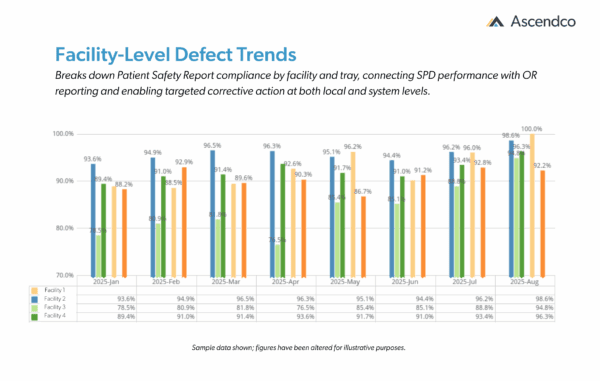
Facility-Level Defect Trends
Breaking down post-sterilization review compliance by facility and tray revealed how SPD and OR practices directly influence one another. This local-to-system view enabled benchmarking, corrective action planning, and stronger collaboration, ensuring quality is managed as a shared responsibility.

Volume of Work by Processing Facility
Sterilization volume tracking by site helped us balance workload and capacity, protecting our goal of maintaining 70% of instruments processed offsite. The dashboard provided the data needed to reallocate resources, address vendor compliance, and prevent onsite SPDs from being overburdened.
HLD (High-Level Disinfection) Load Tracking
This dashboard brought the same level of rigor to high-level disinfection as sterilization, monitoring scope loads, parameters, and failed steps across facilities. The improved visibility strengthened compliance, supported audit readiness, and elevated consistency system-wide.
OR Event Attribution for Centralized Processing
To address questions about how offsite processing affects OR quality events, we built a dashboard that connects those outcomes directly back to centralized workflows. The results validated that centralization improved quality, strengthened feedback loops, and deepened collaboration between SPD and OR.
The Power of Partnership and Progress
For me, analytics has never been about producing reports for the sake of reporting, it’s about creating tools that make our teams stronger, more confident, and more collaborative. Each dashboard provides visibility that empowers teams, informs leadership, and strengthens collaboration between the SPD and OR. More importantly, each one tells a story: from celebrating staff successes to uncovering hidden bottlenecks, from validating certification to proving the value of centralization.
For me, leadership is about being open to what the data reveals—the good, the bad, and the unexpected—and using it to drive meaningful improvement. With Ascendco, we’ve turned data into a narrative of progress that continues to elevate sterile processing.

